








Free CrUX field data report

Core Web Vitals Checker

Enter any public URL to explore Ten months of real-user Core Web Vitals from Chrome UX Report. Check an exact page or the entire domain — no setup required.

Free for Everyone
No credit card required

LCP

Loading

≤ 2.5s

INP

Interactivity

≤ 200ms

CLS

Stability

≤ 0.1

Good-experience thresholds at the 75th percentile

Trusted by teams at

Schbang
DaMENSCH
Staples
Jockey
Speedo
The Pant Project
GIVA
Cityfurnish
Rentomojo
Policybazaar
Matrimony.com
CARS24
MG Motor
MG Select
Propsoch
Cricket.com
The Fragrance Shop

Real-user data, not another lab test

Auditzy™ uses the Chrome UX Report (CrUX), Google's public field dataset, to show how eligible websites perform for real Chrome visitors.

What your report includes

  • Ten months of historical LCP, INP, and CLS trends

  • 75th-percentile performance — the benchmark used for Core Web Vitals

  • Separate desktop and mobile views when data is available

  • Exact URL and origin-level reports for focused or site-wide analysis

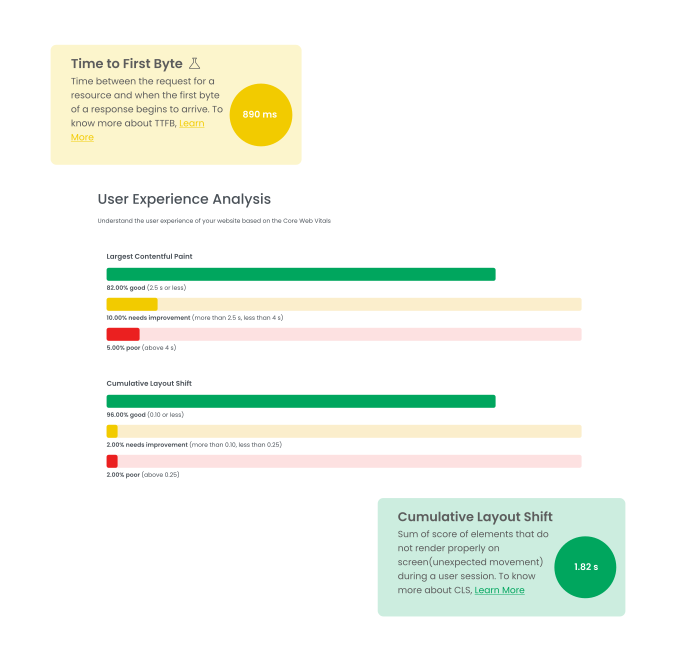
Core Web Vitals checker data source illustration

Turn a score into a useful benchmark

A single score tells you where you stand. A benchmark shows where to focus. Compare available field data across your site and competitors to spot performance gaps faster.

  • Compare mobile and desktop experience trends

  • Use recognizable brands as a performance reference

  • Track whether improvements hold over time

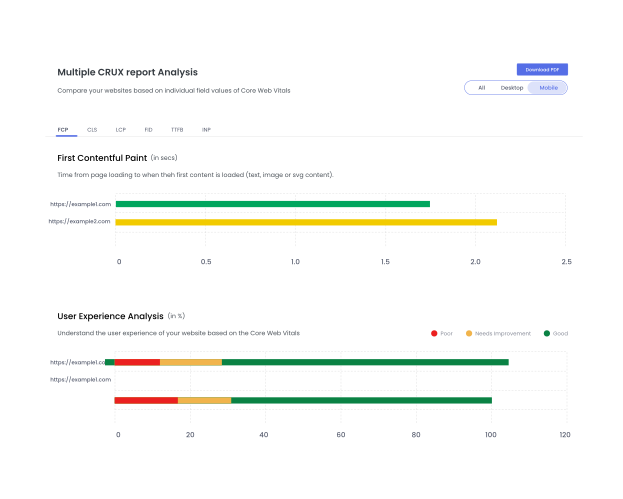
Compare Core Web Vitals score illustration

Explore a report before running your own

Open a sample report from a well-known website to see the historical view, device breakdown, and metric-level detail.

Facebook
Amazon
Hotstar
National Geographic
Built for faster decisions

From raw field data to a clear next step

See the metrics that shape loading, responsiveness, and visual stability in a report your whole team can understand and revisit.

Comprehensive Metrics

Review LCP, INP, and CLS together, with historical context that makes a one-time score easier to understand.

CrUX

Use Google's public Chrome UX Report dataset to understand the experience of real visitors where sufficient data is available.

Powerful Visualisations

Read month-by-month trends and device-level results without installing a script or changing your website code.

Competitor Analysis

Compare available public field data with competing websites to add market context to your performance priorities.

Your real-user performance baseline is one URL away

Start with a free historical report. No installation, account, or credit card required.

Frequently Asked Questions

Everything you need to know about Core Web Vitals Checker and how Auditzy™ uses real-user data.

The data comes from Chrome User Experience Report (CrUX), a public dataset by Google that captures real-user experience metrics from Chrome browsers worldwide. Auditzy™ syncs this field data to generate historical Core Web Vitals reports.

Each report shows LCP, CLS, and INP/FID trends over six months at the 75th percentile — the threshold Google uses for Core Web Vitals evaluation. Green, amber, and red indicators help you see whether metrics are good, need improvement, or poor.

CrUX only includes URLs with enough Chrome traffic to meet Google's privacy thresholds. New sites, low-traffic pages, or recently launched URLs may not have sufficient data yet.

Choose Exact URL when you want to investigate a specific page, such as a homepage, product page, or landing page. Choose Domain for an origin-level view that combines eligible user experiences across the website. Checking both can reveal whether a problem is isolated to one page or affects the broader site.

Not exactly. Lighthouse runs a controlled lab test that helps diagnose potential performance issues at a specific moment. This checker focuses on CrUX field data collected from real Chrome users over time. Lab and field data complement each other: field data shows what visitors experienced, while lab tests help investigate why.

CrUX data is aggregated rather than live, so changes do not appear immediately after a deployment. A report reflects the latest field dataset available and its rolling measurement window. Continue monitoring after a release to confirm whether an improvement or regression persists as new visits are included.

Mobile visitors may use slower networks, less powerful devices, and different screen sizes than desktop visitors. Responsive layouts, image delivery, third-party scripts, and interaction patterns can also behave differently by device, so each experience should be reviewed independently.

The checker relies on public CrUX data, so private, authenticated, local, and most staging pages cannot be evaluated. Use a publicly accessible production URL with enough eligible Chrome traffic for the best chance of finding field data.

Core Web Vitals are part of Google's page experience signals. They do not guarantee rankings, but improving slow or unstable experiences can support both usability and technical SEO.

Focus on the metric in the worst bucket: optimize images and server response for LCP, reserve space for dynamic content to reduce CLS, and break up long JavaScript tasks to improve INP. Auditzy™ helps you track progress after each change.